Defining Social Inequality
We live in a controversial time. Whilst academics and politicians increasingly debate on social inequality and the best way to tackle it, there is the growing impression that the public might not be as concerned by it. In the UK, for example, the gap between rich and poor has reached its highest peak in 30 years, but Ipsos MORI claims only 10% of Britons are worried. On the other hand, today’s policy-makers put a great deal of effort into expressing their concerns or offering solutions for inequality, especially since Nobel Prize-winning economist Paul Krugman has shown that there is a correlation between unequal societies and financial crises.
Before then, inequality had not been considered a cause for concern, in the belief that generic economic growth is indicative of the well-being of society. With more and more data published to support the existence and dangerous potential of an unequal society, and with the emergence of populist politics to channel citizens’ anger on injustices, it is worrying that the public does not seem concerned by social inequality per se.
Social inequality is usually described as the existence of unequal opportunities among different groups of people in society. It implies that differences in income or wealth affect a variety of social goods, such as health, education and mobility. Social inequality is often regarded as an escapable consequence of capitalism or its surrogates, such as neo-liberal economies and free-markets. Marx, Piketty and Dasgupta would even tell us that inequality is indeed a key part of it.
A game changer in the understanding of social inequality has been The Spirit Level, by Professors Wilkinson and Pickett, on the “pernicious effects that inequality has on societies: eroding trust, increasing anxiety and illness, (and) encouraging excessive consumption”. Decades of research by the authors demonstrate that physical health, mental health, drug abuse, education, imprisonment, obesity, social mobility, trust and community life, violence, teenage pregnancies and child well-being, are worse in more unequal societies. The outcome of social inequality can be quite concerning. Putnam, for example, argues that children in the lower class face stresses and traumas foreign to the upper class. In Oren Cass’ words, “they are also five times more likely to face abuse and violence, addiction, and the death or imprisonment of a parent. Those experiences, along with ineffective and unstable caregiving, impair learning and the development of ‘executive functions’ such as concentration, self-discipline, and problem-solving. All these consequences occur independently of public schooling and, largely, before public schooling has even begun. By the time they reach school, 72 percent of middle-class children know the alphabet, Putnam reports, compared with 19 percent of poor children.”
Social inequality is a term too often confused with poverty. Before his second mandate, Obama wanted to make ‘inequality’ the recurrent theme of his presidential term, not poverty. He was of the opinion that in order to diminish poverty and improve life for all, you need to look both at how the rich and how the poor are doing, and in this he was right. Those promoting wars on poverty, proposing to create opportunities for the least wealthy in society, ignore that poverty is dictated in the first place by the existence of richer classes. The corollary is, to tackle poverty you need to tackle inequality, and acknowledge that what generates lower classes lies in the way the rich obtain their wealth. Overall, inequality is a much more complicated matter to understand and until recent years it was not spoken of much, even among scholars. Only recently it has made its way across academic debates and political discussions, and many people still ignore the difference between inequality and poverty. So why are politicians more worried than the citizens themselves? More concerned than the poor? According to Equality Trust, people are simply not aware. Or they underestimate the amount rich people are paid. “For instance, in 2010 just under 10% of people thought FTSE 100 Chief Executives were paid more than £4m, while more than 40% thought they were paid less than £1m. In reality, the average remuneration awarded to CEOs across the FTSE 100 was £4.5m in 2010” And similar findings applied to wealth inequality, the disparity across assets distribution in the UK: “In 2013 they thought that the top 20% of the population owned 39% of wealth and the bottom 20% owned 10%. The actual distribution is far more unequal – the top 20% own 62% while the bottom 20% has less than 1%”.
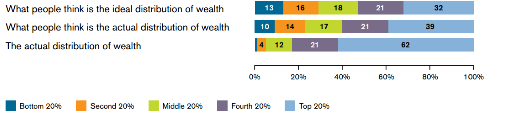
Figure 1: http://www.birmingham.ac.uk/Documents/research/policycommission/BPCIV-Report-Summary—what-the-public-think.pdf
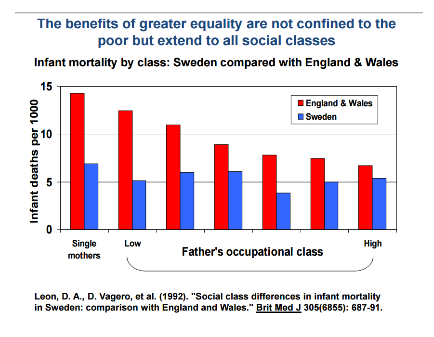
In their book, Wilkinson and Pickett tell us something very important about our societies: our general well-being is no longer measurable through national income (GDP) and economic growth. While this is still the case in developing countries, just like it used to be for us, the new determining factor of well-being in the West is equality. And this does not just apply to the poor, but it extends to the rich: it affects everyone. It is the fact that in the UK, a more unequal country than Sweden, infant mortality in the lowest Swedish social class is still lower than for the British higher class.
Aberdeen
We were confronting statistics across nations and American states, and we realised that no one has yet put together data regarding Aberdeen, the oil capital of Europe, the second richest city in the UK. Originally an international port famous for fishing and farming industries, then the granite trade in the 1800s, Dallas came to Aberdeen in the 1970s with the North Sea Oil boom. For forty years, oil giants like Shell, BP, and Ensco based themselves in the city, bringing immediate and massive wealth to Aberdeen. That is, until 2014, with the most serious and final crash in oil price ever felt by the North East. Hundreds of thousands of jobs have been lost in the UK’s oil and gas sector. While not all based in Aberdeen, they most certainly would have passed through on their way into the North Sea. This led to an unprecedented hit across all of Aberdeen’s industries. Less oil workers means less office parties at Christmas, less taxi rides to and from the airport, less hotel rooms being booked, and less people spending money in local businesses on their days off. How does life go on in a city so hurt by recession?
According to The Guardian, in 2014 the Granite City had the highest concentration of millionaires in the UK. Yet, the same article makes another remark: the oil has transformed this city into a financial heaven for some, but the rest does not enjoy the same benefits. Actually, it has made it worse. With house prices rising 17% only in 2013 and many other goods being overpriced, as well as one of the most unequal wage structures in the UK , there is little surprise that those who are lower in the work hierarchy struggle to have an equally comfortable life. Aberdeen’s unique position in being a city made of substantially different people, owning substantially different amounts of money, being able to afford to consume differently, makes it a perfect subject to study. In short, we want to see if there is such a mantra as “where money goes, social inequality follows”. Can we see the same pattern Wilkinson and Pickett identified for nations and American states inside the United Kingdom? How much different is the life of a rich person to the one of a poor, if not average one, in one of the most economically attractive cities in Europe? How does Aberdeen compare to the national average? We have observed and scrutinised data from the 2011 Census to find this out.
The data
We started by looking at differences in income between Aberdonians. We wanted to see how much more a rich person earns, and generally how many poor and how many rich people there are in Aberdeen. The findings were, to a certain extent, more positive than what we thought: 87% of Aberdonians earn more than the national average. In Scotland, the average household income per year is £24,700, whereas in Aberdeen is £28,600. Per head, instead, is £20,159 in the Granite City and £14,927. On a weekly basis, the ones at the bottom of the ladder in Aberdeen earn an average of £391 per week, while the ones at the top reach £747: quite of a gap. Yet, even though the cost of life is higher in the Silver city, there are proportionally not so many Aberdonians earning below the national average compared to the rest of Scotland. The graph below showcases annual income per household in Aberdeen.
Annual Household Income in Aberdeen
Despite the fact that people’s earnings in Aberdeen might not be the lowest in the country, differences in income can be found here as well. So how does that impact the city? Well, to begin with, it fuels isolation across neighborhoods. Those earning less end up living in cheapest areas, and those earning more end up sharing similar postcodes. One thing we were particularly interested in was assessing whether there are citizens who live in a deprived state, which entails that they lack the means to satisfy the needs considered a necessity in our society. So we have collected information from the Scottish Index of Multiple Deprivation and identified the three most and least deprived neighborhoods. We have listed them below, and the map indicates where they are located within the city boundaries. Deprivation is calculated through an evaluation of the state of various key aspects of life, which include housing, income, employment, geographical access to services, education and health.

However, the existence of deprived areas in Aberdeen does not prove that there is social inequality as well. To assess social inequality in Aberdeen, we needed to compare whether life conditions in richest neighborhoods are higher than in poorer ones. Data regarding Aberdeen’s citizens and the neighbourhood-by-neighbourhood breakdown was gathered through examination of the 2011 census. We identified nine key factors to focus on – population, population by age band, birth country, national identity, persons per room, health, english language, religion and occupation. Once the data was all ready to go, we first examined any trends – did areas with high populations have lower-paid jobs? Were there areas with high non-UK born citizens and higher persons per room? – but found that simply going by the numbers was misleading in results.
We then worked out the percentages of each factor of each criteria: such as how many people in Cove worked in management positions and tried again to identify trends. Eventually, it was concluded that the three areas with the most inequality were Seaton, Bucksburn and Torry, matching with the ones identified through data from the SIMD. All three areas were consistently ranked poorly in health, work outside of skilled trades, and people per room. In contrast, we found the most prosperous areas to be Cults, Bieldside and Milltimber (a single area), the West End, and Braeside, Mannofield, Broomhill and Seafield North (abbreviated to BMBS). These three areas are almost the polar opposites of the least equal areas, with more than 60% of people employed in high-end positions, less than 2% in poor health, and less people per room.
More information was obtained on the Scottish Government’s version of the census, which had a degree of analysis to it but focused primarily on Scotland as a country or Aberdeen as a whole. We used this to see how areas within Aberdeen compare against Scotland. Aberdeen fares well in some areas and poor in others in terms of this comparison. As you might expect, places like Torry, Seaton and Bucksburn all fall into the category of the most deprived 15% of areas within Scotland, which puts their life expectancy at birth to be just over 71 years for men, and just under 78 for women.
We also looked at the rate of immigration in the three highest and lowest areas of social equality in Aberdeen. Areas with higher social equality also had lower rates of immigration. Strangely enough, the rates of immigration from the Middle East and Asia, Africa and America were quite consistent across these six areas.

While we are unable to explain why or how individuals from such nationalities are so evenly spread out across this neighborhoods, we noticed that immigration from within Europe varied a great deal. We wanted to see how and where immigrants fit into the city, whether or not the “immigration crisis” so often spoke of in the run-up to the 2016 European Referendum was true. We found roughly 20% of Torry’s population are non-UK born. Nearly half that are Polish in origin. Similar numbers are seen in Seaton, but the trend seems to stop there. Bucksburn, which also has the lowest rate of immigration at 6..% of its population, and the West end have similar numbers of Polish residents, at around 1.5%. Meanwhile, CBM and BMBS have less than 130 Polish residents between them, for a total of less than 0.5% each.
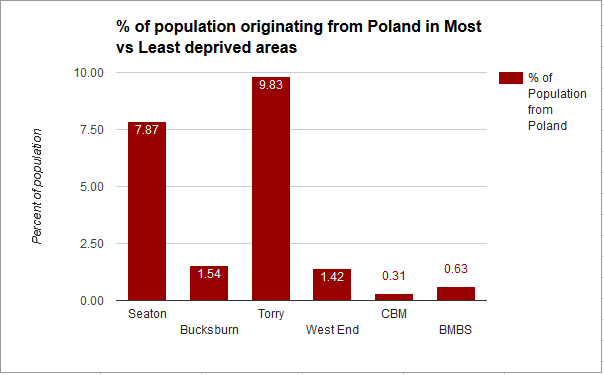
In comparison. the national rate of immigration is 7%, which is significantly higher than both Cults, Bieldside and Milltimber and Braeside, Mannofield, Broomhill and Seafield North. It is also obviously significantly lower Torry, Seaton and the West End. This trend of much higher better than national average in the non-deprived areas and much worse in the deprived areas of Aberdeen is consistent across all these fields.
Similarly, we looked at people’s ability to speak English well in Aberdeen neighborhood. We mapped out people’s skills in three categories – % of non-English speakers per area, % of individuals speaking English well/very well, and % of citizens not speaking English very well. We identified that in the poorest neighborhoods people speak worse English than in the richest ones, an indicator that perhaps education levels differ across neighborhoods, and that potentially this reflects in people’s job opportunities.
% of people who speak English well/very well
% of people who do not speak English at all
% of people who do not speak English well
A Deeper Look – Cults vs Torry
Two neighbourhoods at opposite ends of the spectrum are Cults, Bieldside and Milltimber and Torry. Both have a similar population size and spread of age bands.
The former is a collective of three villages still within the boundaries of the city. Referred to as “CBM” within the council, it has its own quarterly community magazine – MBC News – which has run for over forty years. It features adverts for local businesses, contributions from members of the community, and updates from both the city council representatives for the district and the community council. The magazine is available free to everybody within the district.
Torry, on the other hand, was once an independent entity from Aberdeen and a royal borough in its own right. Traditionally an industrial area, it is now a suburb of Aberdeen City, with more affordable housing to ease overcrowding within the city. Because of this, Torry is viewed as being one of the more international areas of Aberdeen – housing international students, and migrants from Eastern Europe and Poland. However, census data would imply this is a myth as Torry does not even land in the top 10 neighbourhoods of Aberdeen in immigration.
CBM ranks well in regards to every measurement of health as one of the top five best areas for all categories. Less than 3% of its population are listed as not being in good health. Torry’s is twice that and nearly 20% of people living there have long-term illnesses.
In occupation, Torry has half the national average of people in management positions at 3.8%. Furthermore, 43% are unskilled workers and a further 15% work in skilled trades. Three of every four in Cults, Bieldside and Milltimber, however, are employed in the top four tiers of occupation.
Apart from their size, the two areas couldn’t be more different. From their histories to their health and employment. Cults, Bieldside and Milltimber remain one of the most affluent areas in the North East
Drawing Conclusions
Is Aberdeen a place of social equality? Well, it boils down to whether you believe social equality is a low range of variances in data. For instance, is everybody in relatively good health? Or if you believe social equality is achieved through a higher average. Certainly, Aberdeen has a higher average when it comes to earnings – 87% of its population earn the average national – but where the lines become blurred is the gap between the city’s highest and lowest earners. Local celebrities Ian Wood, the oil and gas tycoon-turned-philanthropist, and “Guitar Wifey”, an elderly woman from Romania who frequently sleeps rough and is known for her erratic guitar playing, would probably disagree on the quality of life in Aberdeen.
While the earnings of Aberdeen as a city are pretty high, its varied standards of living are shown in the different life expectancy, which can vary by as much as 7 years between least- and most-deprived areas; as well as crime rates, higher in areas like Seaton, Mastrick and Torry; and health, which is lowest for the less affluent like Bucksburn, Seaton and Torry.
| Estimated life expectancy at birth in Aberdeen | Life Expectancy at birth (years) | 95% Confidance interval (years) | |
| Males | Most deprived 15% | 71.4 | (70.4 to 72.3) |
| Least deprived 85% | 77.7 | (77.3 to 78.1) | |
| Overall | 76.6 | (76.1 to 77.0) | |
| Females | Most deprived 15% | 77.9 | (77.0 to 78.8) |
| Least deprived 85% | 81.6 | (81.2 to 82.0) | |
| Overall | 80.9 | (80.5 to 81.4) | |
Oil and Gas could be a big reason why the average earning of Aberdonians was so high. The naturally-high wages of the industry and its concentration in Aberdeen could be why there is a discrepancy between occupational roles – management, skilled, and service etc – and high average earnings. Now that the dominance of oil and gas is fading from Aberdeen, it is likely that there will be a more observable wage gap.
Is Aberdeen a more equal place than the rest of Scotland? We’re not too sure ourselves. While Wilkinson and Pickett argued that in places with greater social inequality every social class does worse, and that more equal societies are likely to do better as a whole.
Aberdeen kind of fits into this model. Those earning more money are reaping the benefits of their higher wages. But despite the fact that the poorest are not amongst the worst in Scotland – definitely not compared to certain areas of Glasgow – they’re not even close to the standards of the highest class.
It would be interesting in the future to continue to assess how Aberdeen compares to other Scottish cities, especially due to its history of being a wealthy city, to assess whether Wilkinson and Pickett’s theory applies to the whole of the country.
One thing is for certain: social inequality exists. It exists in the data we have gathered and in previous research conducted like the SIMD and the Equality Trust. Social inequality is an ever-evolving phenomena and so constant research must be done to observe its patterns of development.
